
The following is an update of the post Future Cupertino Traffic Projections. This analysis focuses upon the number of Cars in the city and projections of car numbers to 2015 (present time) and 2023 (8 years when the current General Plan (GP) is fully implemented). Two scenarios are presented 1) Full implementation of the GP [worst-case scenario] and 2) Half the implementation of the GP [conservative case].
The Math:
You can skip this section and go directly to The Analysis and Conclusions below if you don’t want to go through the Math. The 1990, 2000, and 2010 Car data at the very bottom Table of this article is directly extracted from the census data since the data for Cars was first started in 1990. Please bear with me for some of this analysis because I wanted those with a math background to understand how the extrapolated data was derived.
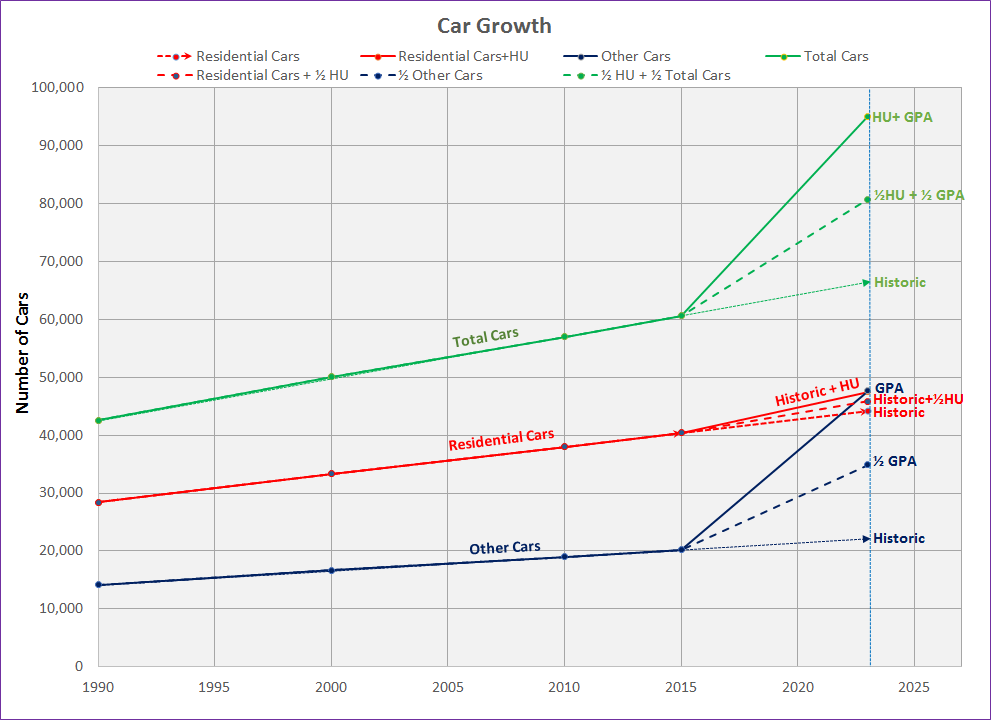
The data was plotted using Excel between 1990 through 2010 below for Residential Cars and the Other Cars from out of town as well as the Total Cars which is the sum of Residential Cars + Other Cars. The graphs are fairly close to straight lines with Rate of Residential cars growth for 1990-2000 was 500 cars/year and for 2000-2010 was 463 cars/year. Rate of Other cars growth for 1990-2000 was 250 cars/year and for 2000-2010 was 232 cars/year. This means that the rate of grow of cars for both Residential growth and Other growth is increasing at a steady rate. To extrapolate into the future the Rate of Residential cars and Rate of Other not associated with the GP was averaged from 1990-2010 (20 years) to 481 and 241 respectively (see Table at bottom).
The number of Residential Housing Units (HU) allocated by the GP is 1,600. If we assume each HU has 2 cars then the total number of cars is 2X1,600 = 3,200. The GP allocates 3,500,000 sq.ft. to Office Space. If we estimated that each office worker will needs around 200 sq.ft. of overall office space then there will be (3,500,000 sq.ft.)/(200 sq.ft/employee) = 17,500 employees. I round this down to 17,000 employees for simplicity. I assumed that each employee would be driving a car from out of town, thus the number of cars they drive equals the number of employees. I then added 8000 cars as an estimate by Apple of the number of cars driven by 13,000 Apple employees. Thus the total number of cars by 2023, the length of the GPA period equals 17,000+8,000 = 25,000 cars. This may be a little low because I am not including other construction underway today not part of the current GP. I added the Apple cars to the GP cars to simplify the explanation but the numbers all add up in the end. To extrapolate the total number of cars I simple used the averaged Rate of Residential and Rate of Other to calculate the normal Residential Cars and Other Cars in to 2023 then added the number of HU cars to the historic Residential Cars and added the number of GP cars to the historic Other Cars from 2015 to 2023 (steeper part of curves). This give the worst-case scenario.
To give the best case scenario I cut the number GP Other Cars in half and added these number to the historic predictions. The Table and Car Growth graph below present this data.
The Analysis and Conclusions:
The most telling of this analysis is the differing rates of increase in Car growth. This is measured by the Slop of the curves at different times. From 1990 to 2010 a period of 20 years the growth rate of both Residential Cars and Other Cars from out of town was constant. The Rate of Residential growth over 20 years averaged 481 cars per year and the Rate of Other cars from out of town averaged 241 cars per year. It is assumed this rate of growth continued up to 2015 since there is no data. Then between 2015 to 2023 or 8 years of GP related growth it took a sharp turn upward to (47,460–40,410)cars/8 years = 881.25 cars/year for Rate of Residential due to the HU allocations and skyrocketed to (47,630–20,205)cars/8 years = 3428.125 cars/year for Rate of Other cars from out of town due to the huge jump in 3.5 million sq. ft. Office Space allocations. The table below displays the data more clearly.
| 1990-2015 cars/yr. |
2015-2023 cars/yr. |
Increase In Rate |
½ 2015-2023 cars/yr. |
|
|---|---|---|---|---|
| Rate of Residential | 481 | 881 | 83% | |
| Rate of Other | 241 | 3,428 | 1,322% | 1,714 |
It is very clear that there is a dramatic 1,322% increase or more than a 14 fold increase in the Rate of Other cars from employees due to the huge amount of allocated Office Space in the GP. Even reducing the Rate of Other cars by half is still more than a 7 fold increase over the earlier normal growth rate. Note that the number of Other Cars (from out of town) intersect the Residential Car curve at the end of 2023. This means that the number of residential cars equals the number of cars from people not living in Cupertino.
The Total Cars is the graph of the total of the Residential Car and the Other Cars curve. In 2015 the total number of cars was 60,615 but only 8 years later the total number of cars will increase to 95,089 and increase of 34,474 cars, more than half the total number of cars that exist today. It can clearly be seen the unprecedented explosion of car growth due to the GP Office Space. Even reducing the growth of Other Cars and HU by half (conservative case) results in a total of 80,739 cars or an increase of 20,124 car is still hugely significant. Such growth in the rate of cars is UNSUSTAINABLE.
We should expect major traffic congestion withing the next 3-5 years if something dramatic is not done. This will impact the quality of life for residents, schools, visitors, and employees working in Cupertino. Expect very long commute times within our city especially during the heaviest of traffic. To put thing into perspective 8 years of upcoming 8 year growth is equivalent to 8X14= 112 years of normal 1990-2010 growth (worst case). The conservative scenario is 8X7 = 56 years of normal growth in 8 years.


Pingback: Future Cupertino Traffic Projections | Biking Cupertino